Maturity Model
Every organization's digital path is unique. To determine the best path forward, it's important to identify the current level of digital maturity. The interactive maturity model shown here assists clients in assessing their progress and highlighting areas for improvement. For details on each stage, simply click the red points along the curve.
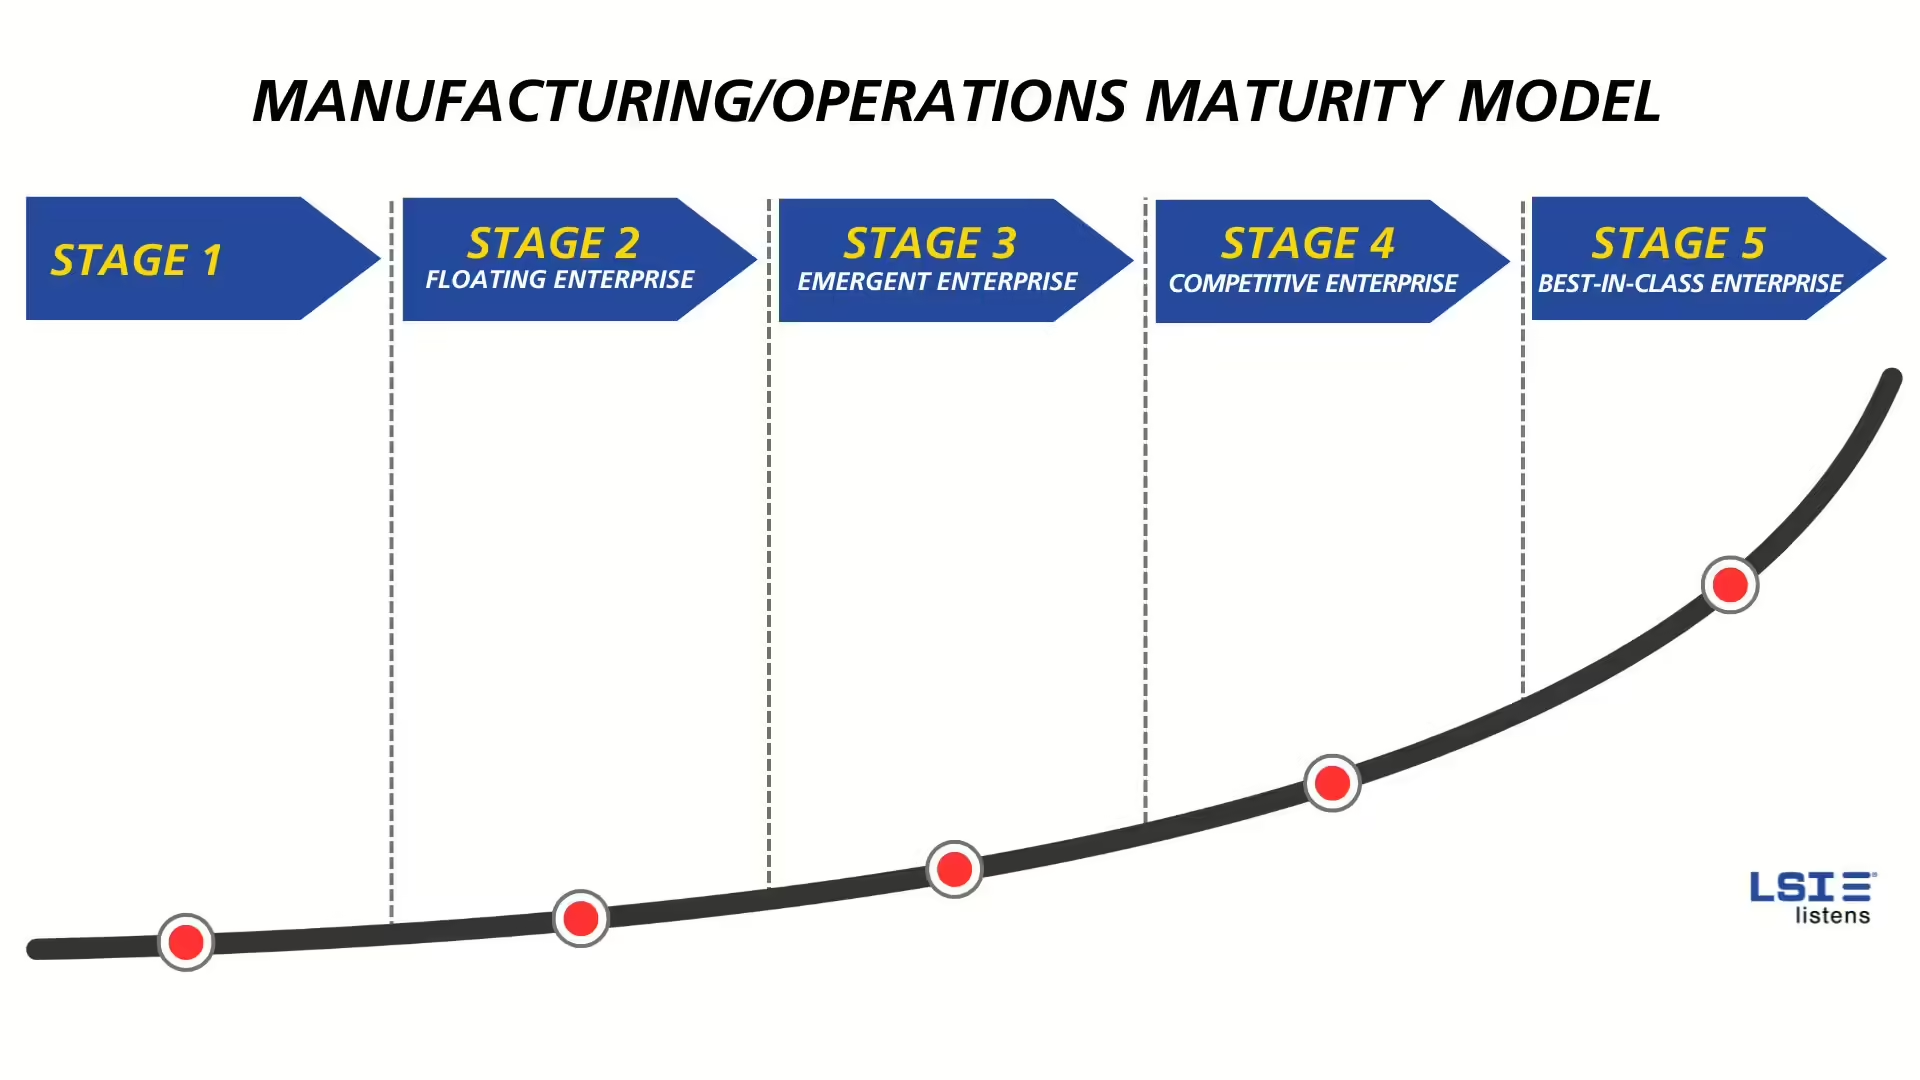
Stage 1
Paper-based recording (e.g. ‘order packet’)
Information lag from manufacturing (we know what happened yesterday)
Slower/ delayed reaction times to process excursions/ deviations/ downtime events
Communications by radio or word-of-mouth (yes, this does still occur in some businesses)
Information in silos (e.g. Access Database on a local hard drive)
Stage 2
- No longer paper-based
- Information from the process is in real-time - collected into central repository – one version/ trust
- Information silos are integrated
- Reaction to process events when they happen
- Clear realization/ visualization of OEE
- Genealogy/ traceability of plant floor (not just in ERP)
- Manufacturing/ business operating in the black - allowing for a re-investment budget
Stage 3
- Stage 2 practices
- OT/IT network best-in-class/ Risk mitigated (cybersecure)
- 'Other' system integration with operations (ERP, WMS, MMS, LIMS, PLM)
- Starting to practice lean methodologies
- Continuous improvement and project justification backed by real data
- Quick root cause and remediation (quality, process downtime, etc.)
Stage 4
- Stage 3 practices
- Customer-facing and transparent
- One or two facilities are mostly best-in-class (Stage 5) and templates/ standards evolved to apply to other plants
Stage 5
- Enterprise-wide connected/ visibility and comparison
- Enterprise logistics/ resource sharing/ agility to change due to market conditions
- Data analytics - AI/ machine learning
- Digital twin/ minimize time for NPI (new product introduction) (tight engineering/ mfg loop)
- Minimized workforce through robotics and/ or AR/VR as operator guidance
- Leanest enterprise, minimal lead times, minimal parts inventory, leaned-out costing/ maximized margins
- Effective/automated predictive maintenance – longer road to prescriptive
- Maximized quality/ minimal waste
- Customer connected
- Thought leadership in the industry